
Data Analysis
Data Analysis
Your data, worked out once and used everywhere. I turn the raw data in your systems into clean, reliable figures your business can trust, then deliver them where your people actually work: in Excel, in Power BI, or built into your own web applications.
Lots of data. Not many answers.
Most businesses aren’t short of data. It’s sitting in the databases, csv files, SharePoint, and a dozen spreadsheets. The trouble is getting a straight answer out of it.
Different reports give different totals. Nobody’s quite sure which spreadsheet is the latest. And the questions that matter most, like why orders are late, which customers are profitable or where the time is going, take days to answer, if they get answered at all.
Good analysis fixes that. It starts with getting the data right, and then puts the answers in front of the people who need them

Our amazing team is always hard at work
One source of truth, three ways to use it
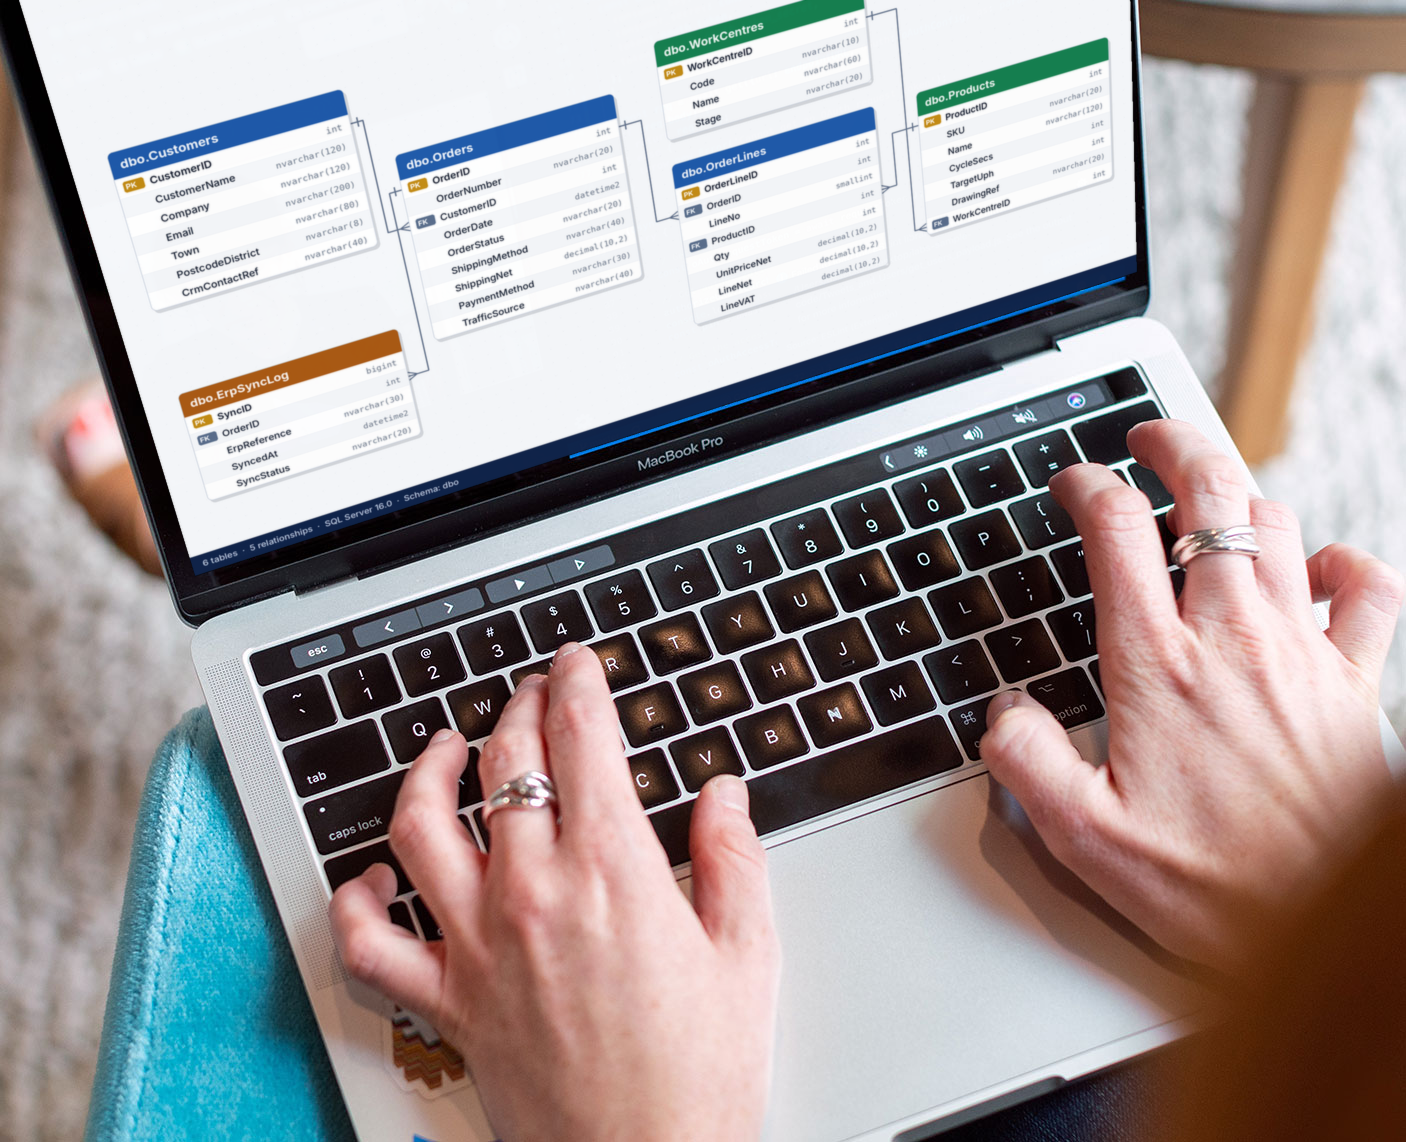
I build the analysis once, on a clean and properly structured data set. You then use the same trusted figures wherever they’re most useful.
In Excel
Refreshable workbooks connected straight to your data, ready to filter, pivot and chart. Your team keeps working in the tool they already know, but the numbers are always current and always right.
In Power BI
Interactive dashboards that show the whole picture on one screen, from the headline figure down to the individual order. They refresh automatically and can be shared across the business on PC, laptop or phone.
In your web applications
The same data served to your own websites, portals and internal tools, so customers, suppliers or shop-floor staff see live figures without logging into anything new. Order status on a customer portal, KPIs on a factory screen, stock levels on your website.
Because all three draw from the same source, the number in the spreadsheet matches the dashboard, and the dashboard matches the website.


What I analyse
Operations and production – Delays by cause and work centre, on-time delivery, OTIF, scrap and rework, capacity and output against plan.
Orders and sales – Orderbook value and health, margin by customer and product, trends over time, forecast against actual.
Customers and web – Where enquiries and orders come from, what converts, which customers buy again, and what your marketing actually returns.
Data quality – Duplicates, missing values, mismatched codes and figures that don’t reconcile, found and fixed before they cause a bad decision.