Services

Data Analysis

Data Analysis

Your data, worked out once and used everywhere. I turn the raw data in your systems into clean, reliable figures your business can trust, then deliver them where your people actually work: in Excel, in Power BI, or built into your own web applications.

Lots of data. Not many answers.

Most businesses aren’t short of data. It’s sitting in the databases, csv files, SharePoint, and a dozen spreadsheets. The trouble is getting a straight answer out of it.

Different reports give different totals. Nobody’s quite sure which spreadsheet is the latest. And the questions that matter most, like why orders are late, which customers are profitable or where the time is going, take days to answer, if they get answered at all.

Good analysis fixes that. It starts with getting the data right, and then puts the answers in front of the people who need them

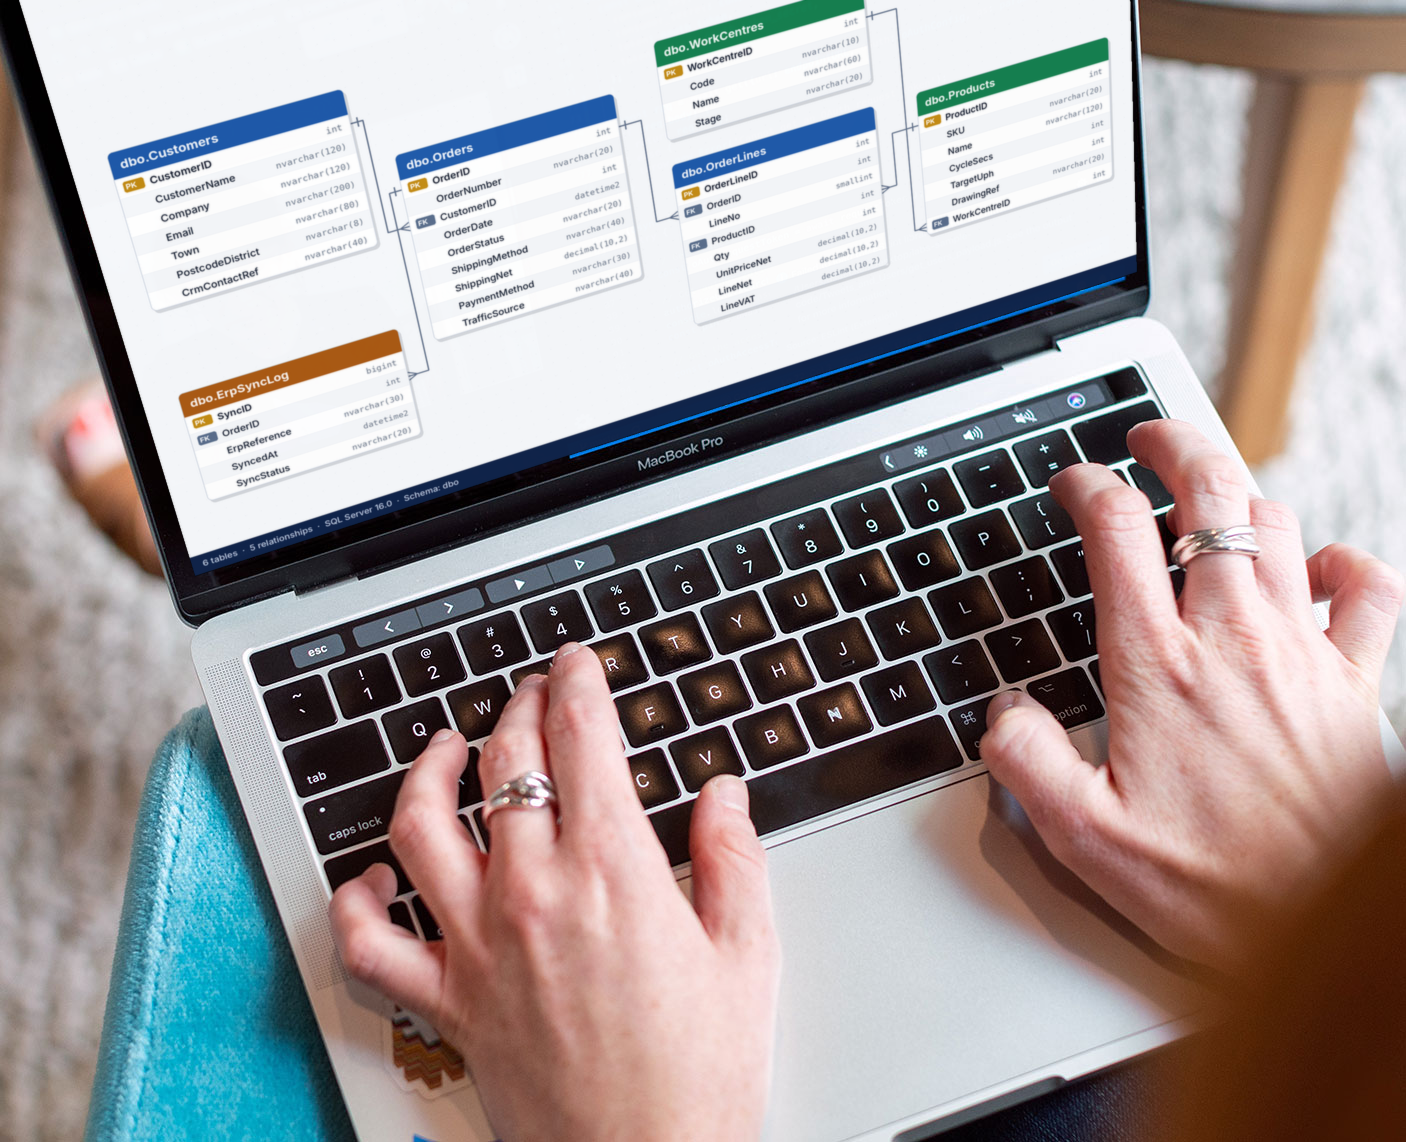
Person Working on Tablet

Our amazing team is always hard at work

One source of truth, three ways to use it

I build the analysis once, on a clean and properly structured data set. You then use the same trusted figures wherever they’re most useful.

In Excel

Refreshable workbooks connected straight to your data, ready to filter, pivot and chart. Your team keeps working in the tool they already know, but the numbers are always current and always right.

In Power BI

Interactive dashboards that show the whole picture on one screen, from the headline figure down to the individual order. They refresh automatically and can be shared across the business on PC, laptop or phone.

In your web applications

The same data served to your own websites, portals and internal tools, so customers, suppliers or shop-floor staff see live figures without logging into anything new. Order status on a customer portal, KPIs on a factory screen, stock levels on your website.

Because all three draw from the same source, the number in the spreadsheet matches the dashboard, and the dashboard matches the website.


What I analyse

Operations and production – Delays by cause and work centre, on-time delivery, OTIF, scrap and rework, capacity and output against plan.

Orders and sales – Orderbook value and health, margin by customer and product, trends over time, forecast against actual.

Customers and web – Where enquiries and orders come from, what converts, which customers buy again, and what your marketing actually returns.

Data quality – Duplicates, missing values, mismatched codes and figures that don’t reconcile, found and fixed before they cause a bad decision.

Testimonials

What our clients say about us

  • During his time working as an IT Manager within our global manufacturing business, James played a pivotal role in the development and continuous improvement of our business intelligence and data analytics capabilities.

    He demonstrated a rare ability to evolve alongside the organization’s growing data maturity, starting with the delivery of Informix 4GL reporting solutions that provided reliable operational and financial insights directly from core business systems. As our needs expanded, he developed advanced Excel-based data extracts that enabled greater flexibility and accessibility of information for business users across multiple departments.

    Over time, James progressed our reporting environment further by implementing and supporting solutions using Crystal Reports and SQL Server Reporting Services (SSRS). These tools allowed for more structured, automated, and scalable reporting across key business areas including finance, production, supply chain, and sales, significantly improving data consistency and reducing manual reporting effort.

    He also contributed to the implementation of SSIS-based data integration processes, enabling more robust and reliable data flows between disparate systems and supporting a more centralised reporting approach. This was a key step in improving the integrity and availability of business-critical data.

    Throughout his time with us, he consistently demonstrated strong technical capability, clear business understanding, and a focus on delivering meaningful, actionable insight from complex data environments. His contribution has had a lasting impact on how we consume and use data to support decision-making across the organization.

    data:image/svg+xml;utf8,%3Csvg%20xmlns%3D%22http%3A%2F%2Fwww.w3.org%2F2000%2Fsvg%22%20width%3D%221000%22%20height%3D%221000%22%20viewBox%3D%220%200%201000%201000%22%3E%3Crect%20fill%3D%22%23d85927%22%20width%3D%221000%22%20height%3D%221000%22%2F%3E%3Ctext%20fill%3D%22rgba%28255%2C255%2C255%2C0.5%29%22%20font-family%3D%22sans-serif%22%20font-size%3D%2230%22%20dy%3D%2210.5%22%20font-weight%3D%22bold%22%20x%3D%2250%25%22%20y%3D%2250%25%22%20text-anchor%3D%22middle%22%3E1000%C3%971000%3C%2Ftext%3E%3C%2Fsvg%3E

    Joe

  • While James was already engaged with us on another project, we brought in a business improvement consultant who required detailed sales and production information from our systems. This was data we had previously struggled to extract in a meaningful and timely way from our SysPro environment.

    We asked James whether it would be possible to retrieve and structure this information, despite him not having prior exposure to the SysPro database. He quickly demonstrated an impressive ability to understand the underlying data structure, identify where key information was stored, and determine how the various data tables and relationships connected.

    Within a short period of time, he was able to deliver the required datasets in a clear and usable format, meeting the consultant’s requirements and enabling the project to progress without delay.

    Our preferred method of working was through Excel-based reporting, and it became immediately apparent that James had exceptional Excel and data manipulation skills. He introduced us to parameter-driven data extraction techniques directly from the database into Excel, a capability we had not previously utilized, and which significantly improved our ability to interrogate and analyze business data.

    Following the success of this work, James also developed a number of interactive Excel-based tools that allowed users to access and analyse information far more efficiently. These solutions saved the business countless hours of manual reporting and significantly improved access to timely, accurate information.

    Overall, his ability to quickly understand complex systems, extract meaningful data, and deliver practical, user-friendly solutions had an immediate and lasting impact on our reporting capabilities.

    Kevin

  • Our quality system held all the right data, but getting useful information out of it was a constant struggle. James understood the problem straight away. He built a set of reports using DirectQuery that pull live data straight from the system, so the figures are always current and accurate. They’re clearly presented, easy for the whole team to access, and have saved us hours of manual work. We now have the visibility we needed to manage quality properly. I’d happily recommend James to anyone whose systems aren’t giving them the information they need.

    data:image/svg+xml;utf8,%3Csvg%20xmlns%3D%22http%3A%2F%2Fwww.w3.org%2F2000%2Fsvg%22%20width%3D%221000%22%20height%3D%221000%22%20viewBox%3D%220%200%201000%201000%22%3E%3Crect%20fill%3D%22%23d85927%22%20width%3D%221000%22%20height%3D%221000%22%2F%3E%3Ctext%20fill%3D%22rgba%28255%2C255%2C255%2C0.5%29%22%20font-family%3D%22sans-serif%22%20font-size%3D%2230%22%20dy%3D%2210.5%22%20font-weight%3D%22bold%22%20x%3D%2250%25%22%20y%3D%2250%25%22%20text-anchor%3D%22middle%22%3E1000%C3%971000%3C%2Ftext%3E%3C%2Fsvg%3E

    Mo