
Digital Dashboard Solution
Digital Dashboard Solution
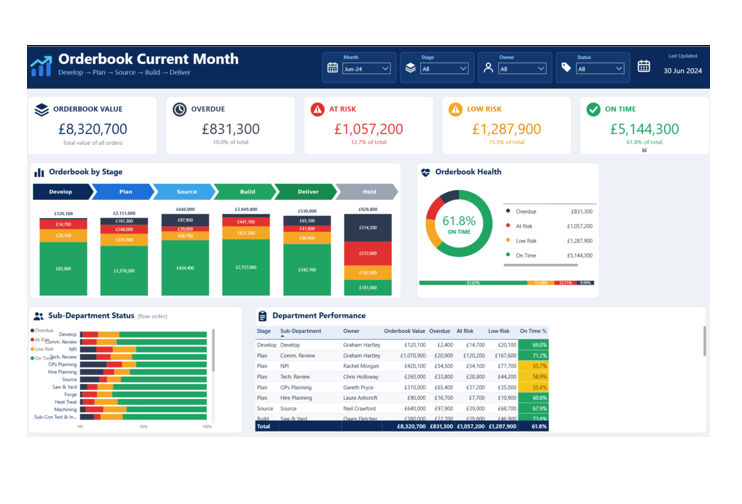
From conflicting reports to one version of the truth
My client, a UK manufacturer, was struggling with information they couldn’t trust. Figures on order status, delays and delivery performance came from many sources: the ERP, departmental spreadsheets and manual reports, and they rarely agreed. Meetings were spent arguing over whose numbers were right rather than fixing the problems. The business needed a clear, accurate picture of what was really happening across its manufacturing process, from planning through to delivery.
Working alongside an independent consultant who specialises in on-time delivery performance, I designed and delivered a digital dashboard that brought all of that data together into one trusted source. The consultant shaped the measures that mattered; I built the data model, cleaned and reconciled the source data, and turned it into clear KPI visualisations. These covered orderbook value and health, on-time, at-risk and overdue orders, delay causes by department and work centre, and performance trends over time. For the first time, managers could see exactly where orders stood and why they were late, drill down to the individual department or works order, and act on facts rather than opinions.
Project Tasks
Project Details
Built with a custom dashboarding solution with a SQL Server data model, using stored procedure to bring together and clean data from the ERP , and measures to calculate every KPI consistently.