What is Customer Satisfaction Score (CSAT)?
Customer Satisfaction Score — commonly abbreviated as CSAT — is one of the most widely used and directly meaningful metrics available to any business. At its core, CSAT asks customers a simple question: “How satisfied were you with your experience?” Responses are typically collected on a 1–5 or 1–10 scale, with the final score expressed as a percentage of customers who gave a positive rating.
The formula is straightforward: divide the number of satisfied customers by the total number of respondents and multiply by 100. A score of 80% means 80 out of every 100 customers left an interaction feeling positive. Simple to understand — but powerful in its implications.

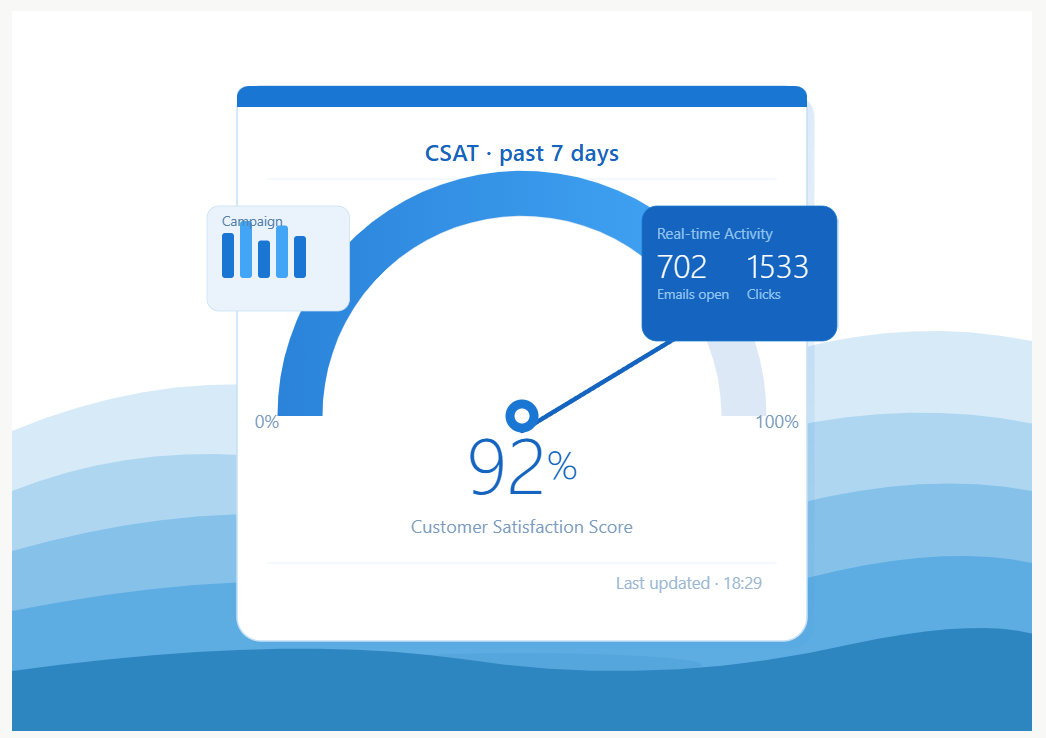
Why CSAT is Critical for Every Organisation
In a competitive marketplace, the cost of losing a customer far exceeds the cost of keeping one. Research consistently shows that acquiring a new customer can cost five times more than retaining an existing one. CSAT sits at the heart of this equation — it tells you, in near real-time, whether your customers are likely to stay, return, and recommend you to others.
Beyond retention, CSAT data informs almost every department within a business. For operations teams, it highlights process failures. For product teams, it exposes friction in the user journey. For HR, a declining CSAT in customer-facing roles can signal training needs or staffing gaps. When treated as a strategic metric rather than a box-ticking exercise, CSAT becomes a shared language that connects the voice of the customer to every corner of the business.
You Probably Have More Data Than You Realise
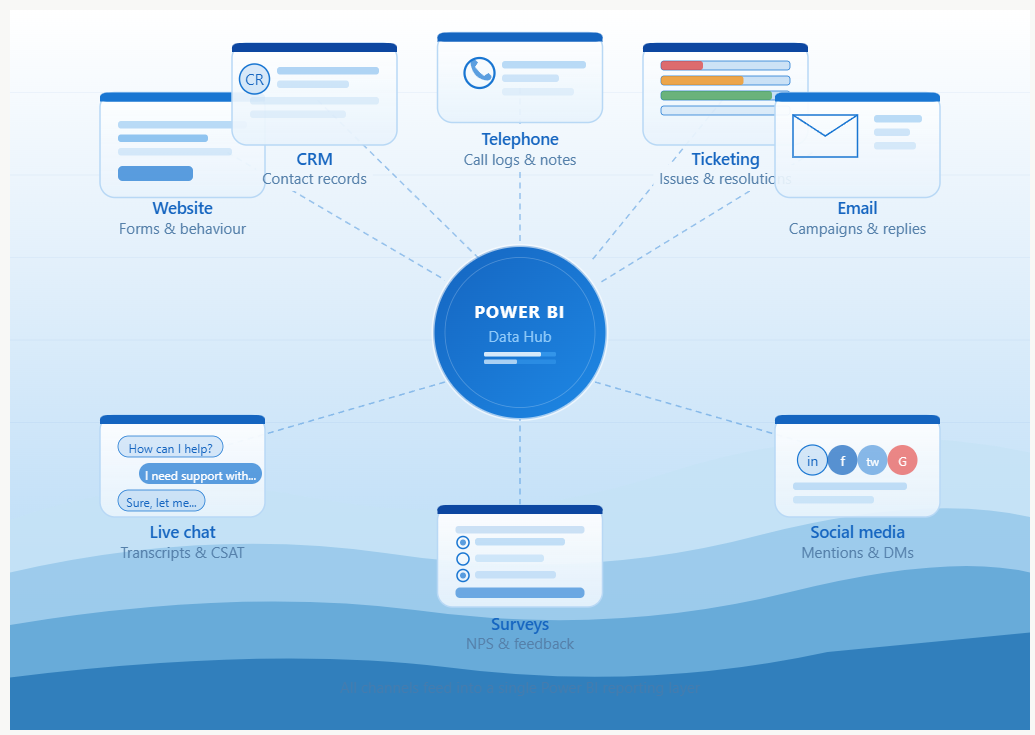
One of the most common discoveries when working with businesses on their customer data is how much relevant information already exists — completely untapped. CSAT-relevant data doesn’t only live in post-transaction surveys. It accumulates across every customer touchpoint: support ticketing systems, email response times, online reviews, live chat logs, CRM records, social media mentions, NPS responses, warranty claims, and even time-to-resolution data in field service systems.
Many organisations capture this data as a matter of operational necessity — logging support tickets, recording call outcomes, noting complaint categories — without ever connecting the dots. The result is a fragmented picture: islands of data that individually seem unremarkable, but together paint a detailed and actionable portrait of customer sentiment across the entire journey.
Best Practices for Using Power BI for CSAT Reporting
Define Clear KPIs
Track metrics such as:
CSAT Score (Customer Satisfaction Score)
Measures how satisfied customers are with a product, service, or interaction, usually through a simple survey such as “How satisfied were you?” on a scale of 1–5.<br />
Net Promoter Score (NPS)
Measures customer loyalty by asking how likely customers are to recommend your company to others, typically scored from 0–10. It groups people into Promoters, Passives, and Detractors.<br />
Customer Effort Score (CES)
Measures how easy it was for a customer to complete a task or resolve an issue. Lower effort usually means a better customer experience. Think of it as the “friction detector.<br />
Ticket Resolution Time
The average amount of time it takes to fully resolve a customer support ticket from opening to closure.<br />
First Response Time (FRT)
Measures how long it takes for a customer to receive the first reply after raising a query or support ticket. Fast responses often improve satisfaction even before resolution.<br />
Churn Rate
Measures the percentage of customers who stop using a service or leave within a given period. A high churn rate can signal dissatisfaction, pricing issues, or stronger competitors drifting in like customer-magnet spaceships